NHGRI logo

For many years, the National Human Genome Research Institute (NHGRI) has tracked the costs associated with DNA sequencing performed at the sequencing centers funded by the Institute. This information has served as an important benchmark for assessing improvements in DNA sequencing technologies and for establishing the DNA sequencing capacity of the NHGRI Genome Sequencing Program. Here, NHGRI provides an analysis of these data, which gives one view of the remarkable improvements in DNA sequencing technologies and data-production pipelines in recent years.

Overview

The cost-accounting data presented here are summarized relative to two metrics: (1) "Cost per Megabase of DNA Sequence" - the cost of determining one megabase (Mb; a million bases) of DNA sequence of a specified quality [see below]; (2) "Cost per Genome" - the cost of sequencing a human-sized genome. For each, a graph is provided showing the data since 2001; in addition, the actual numbers reflected by the graphs are provided in a summary table.

NHGRI welcomes people to download these graphs and use them in their presentations and teaching materials. NHGRI plans to update these data on a regular basis. You can view the data in in Excel by downloading the Sequencing Costs 2022.


Sequencing Cost Per Megabase


Graph: Sequencing Cost Per Genome


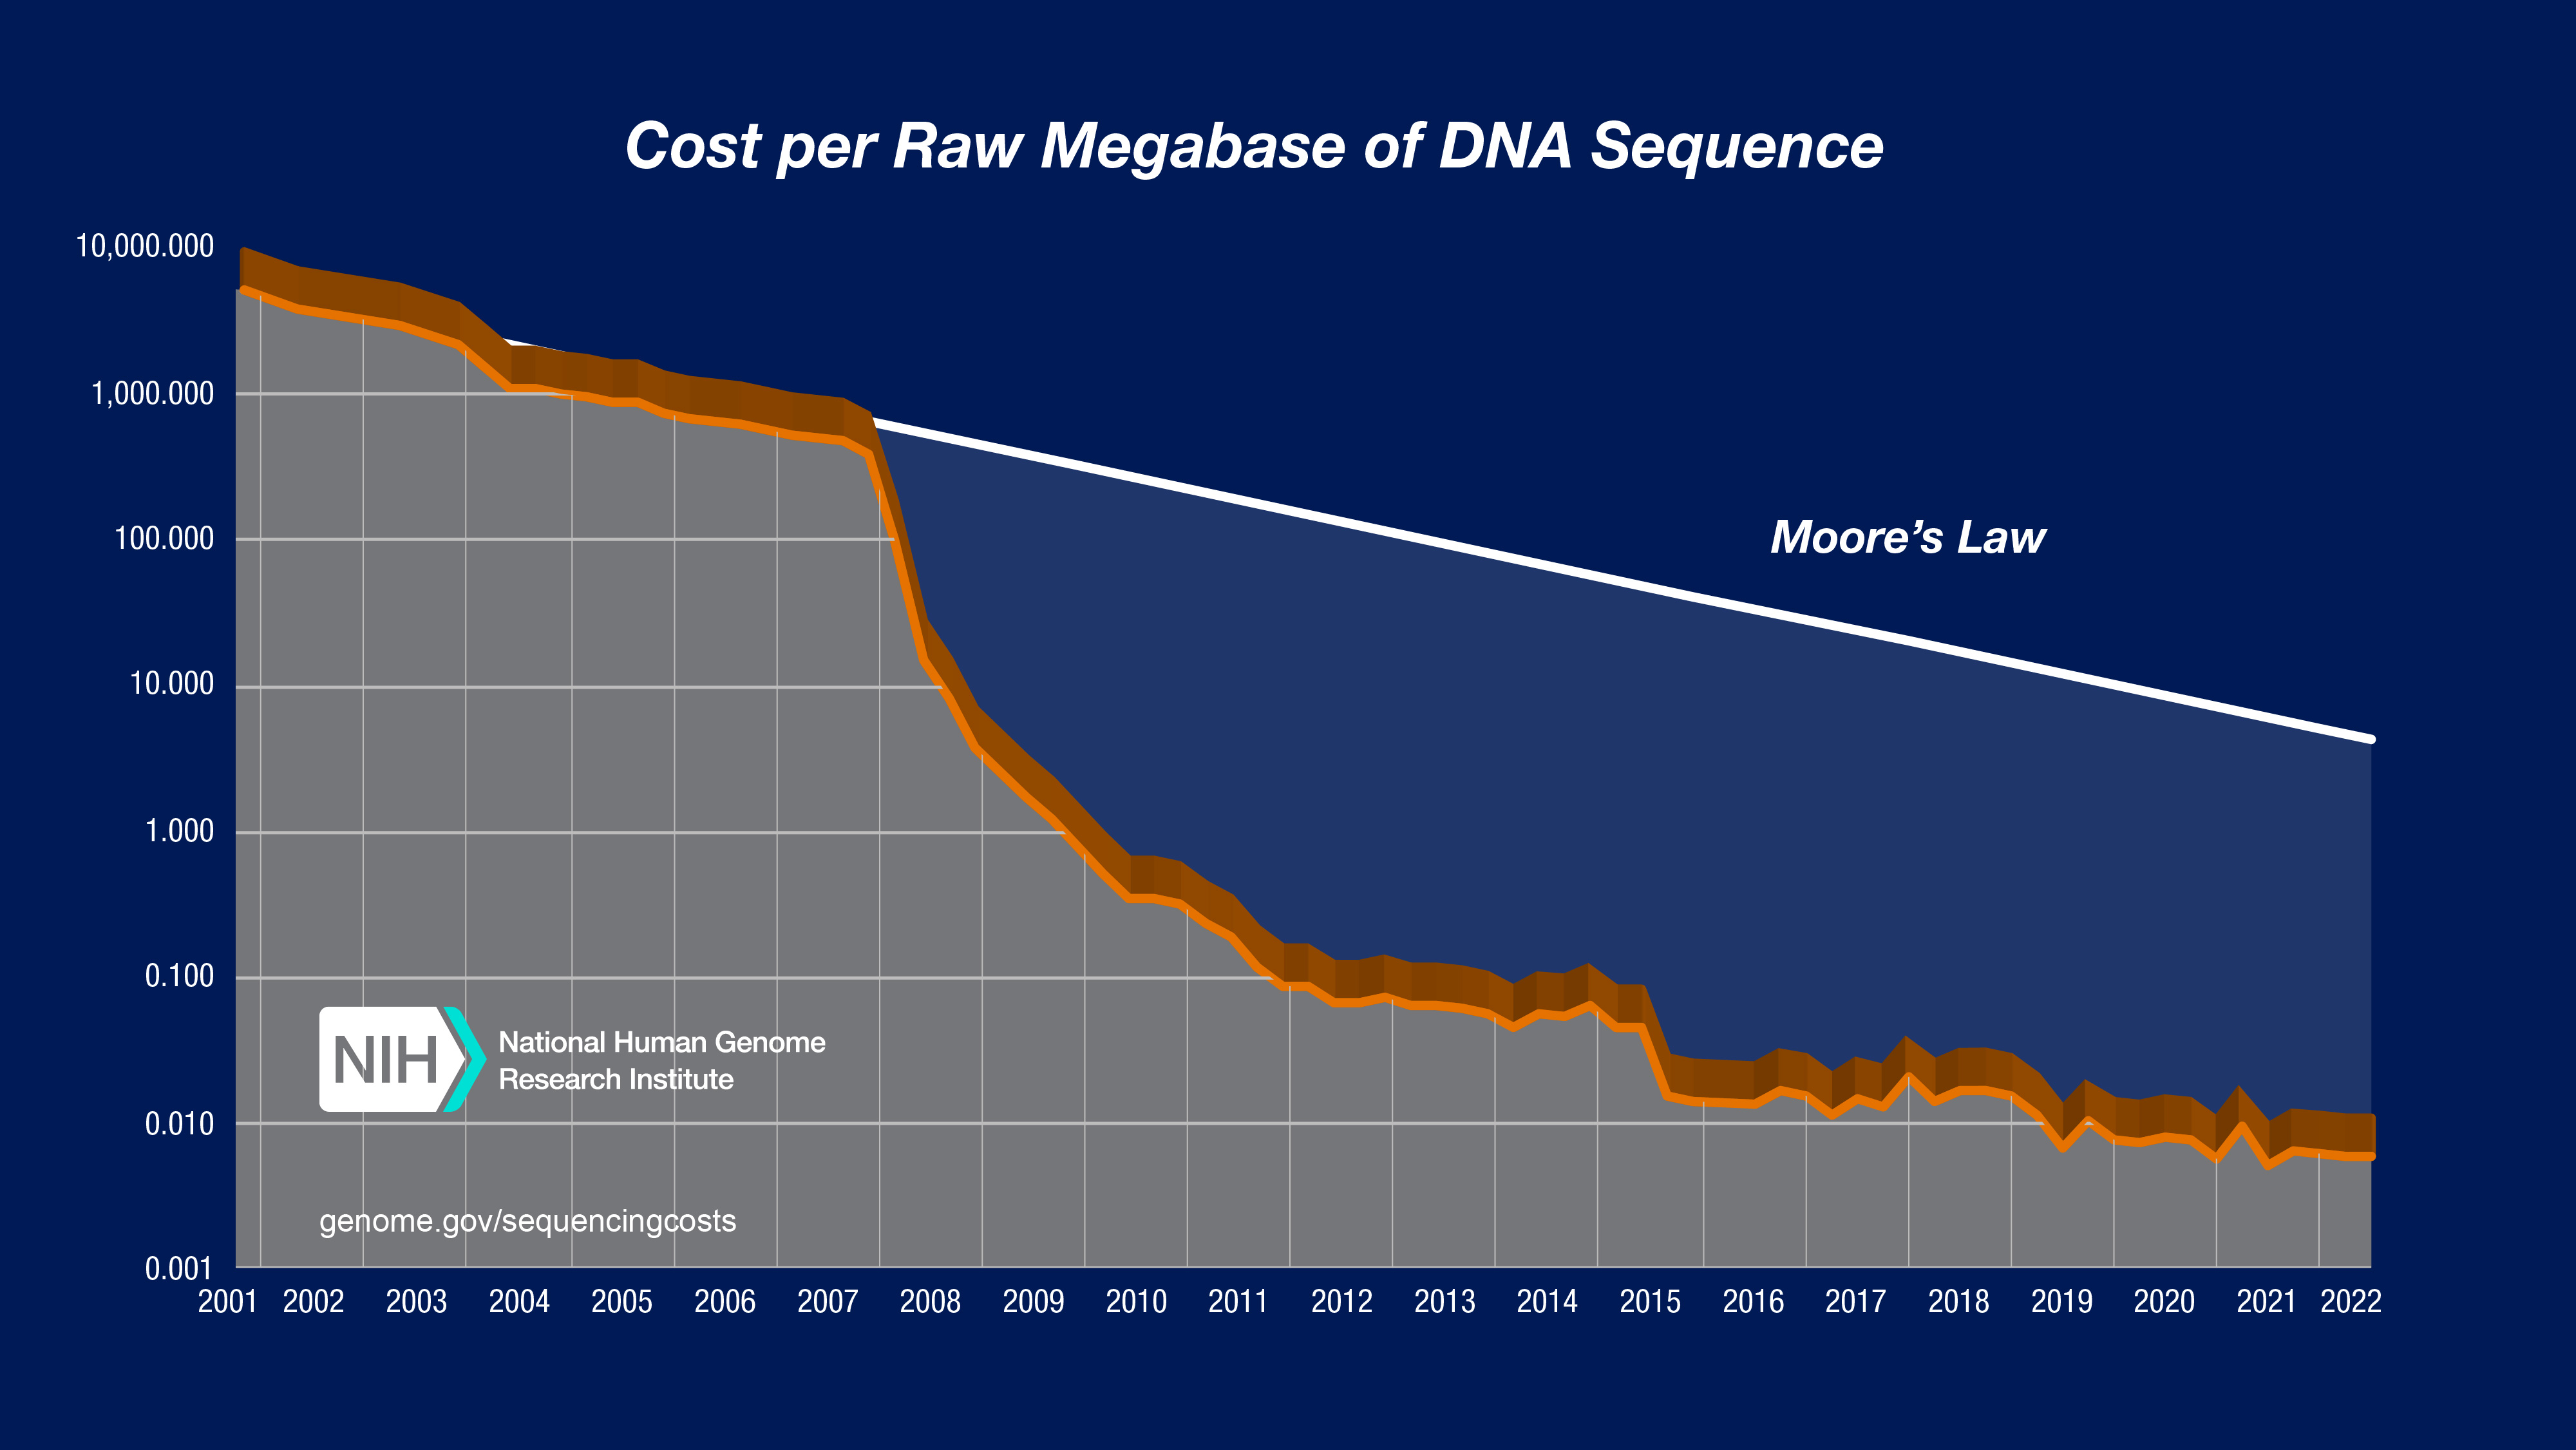
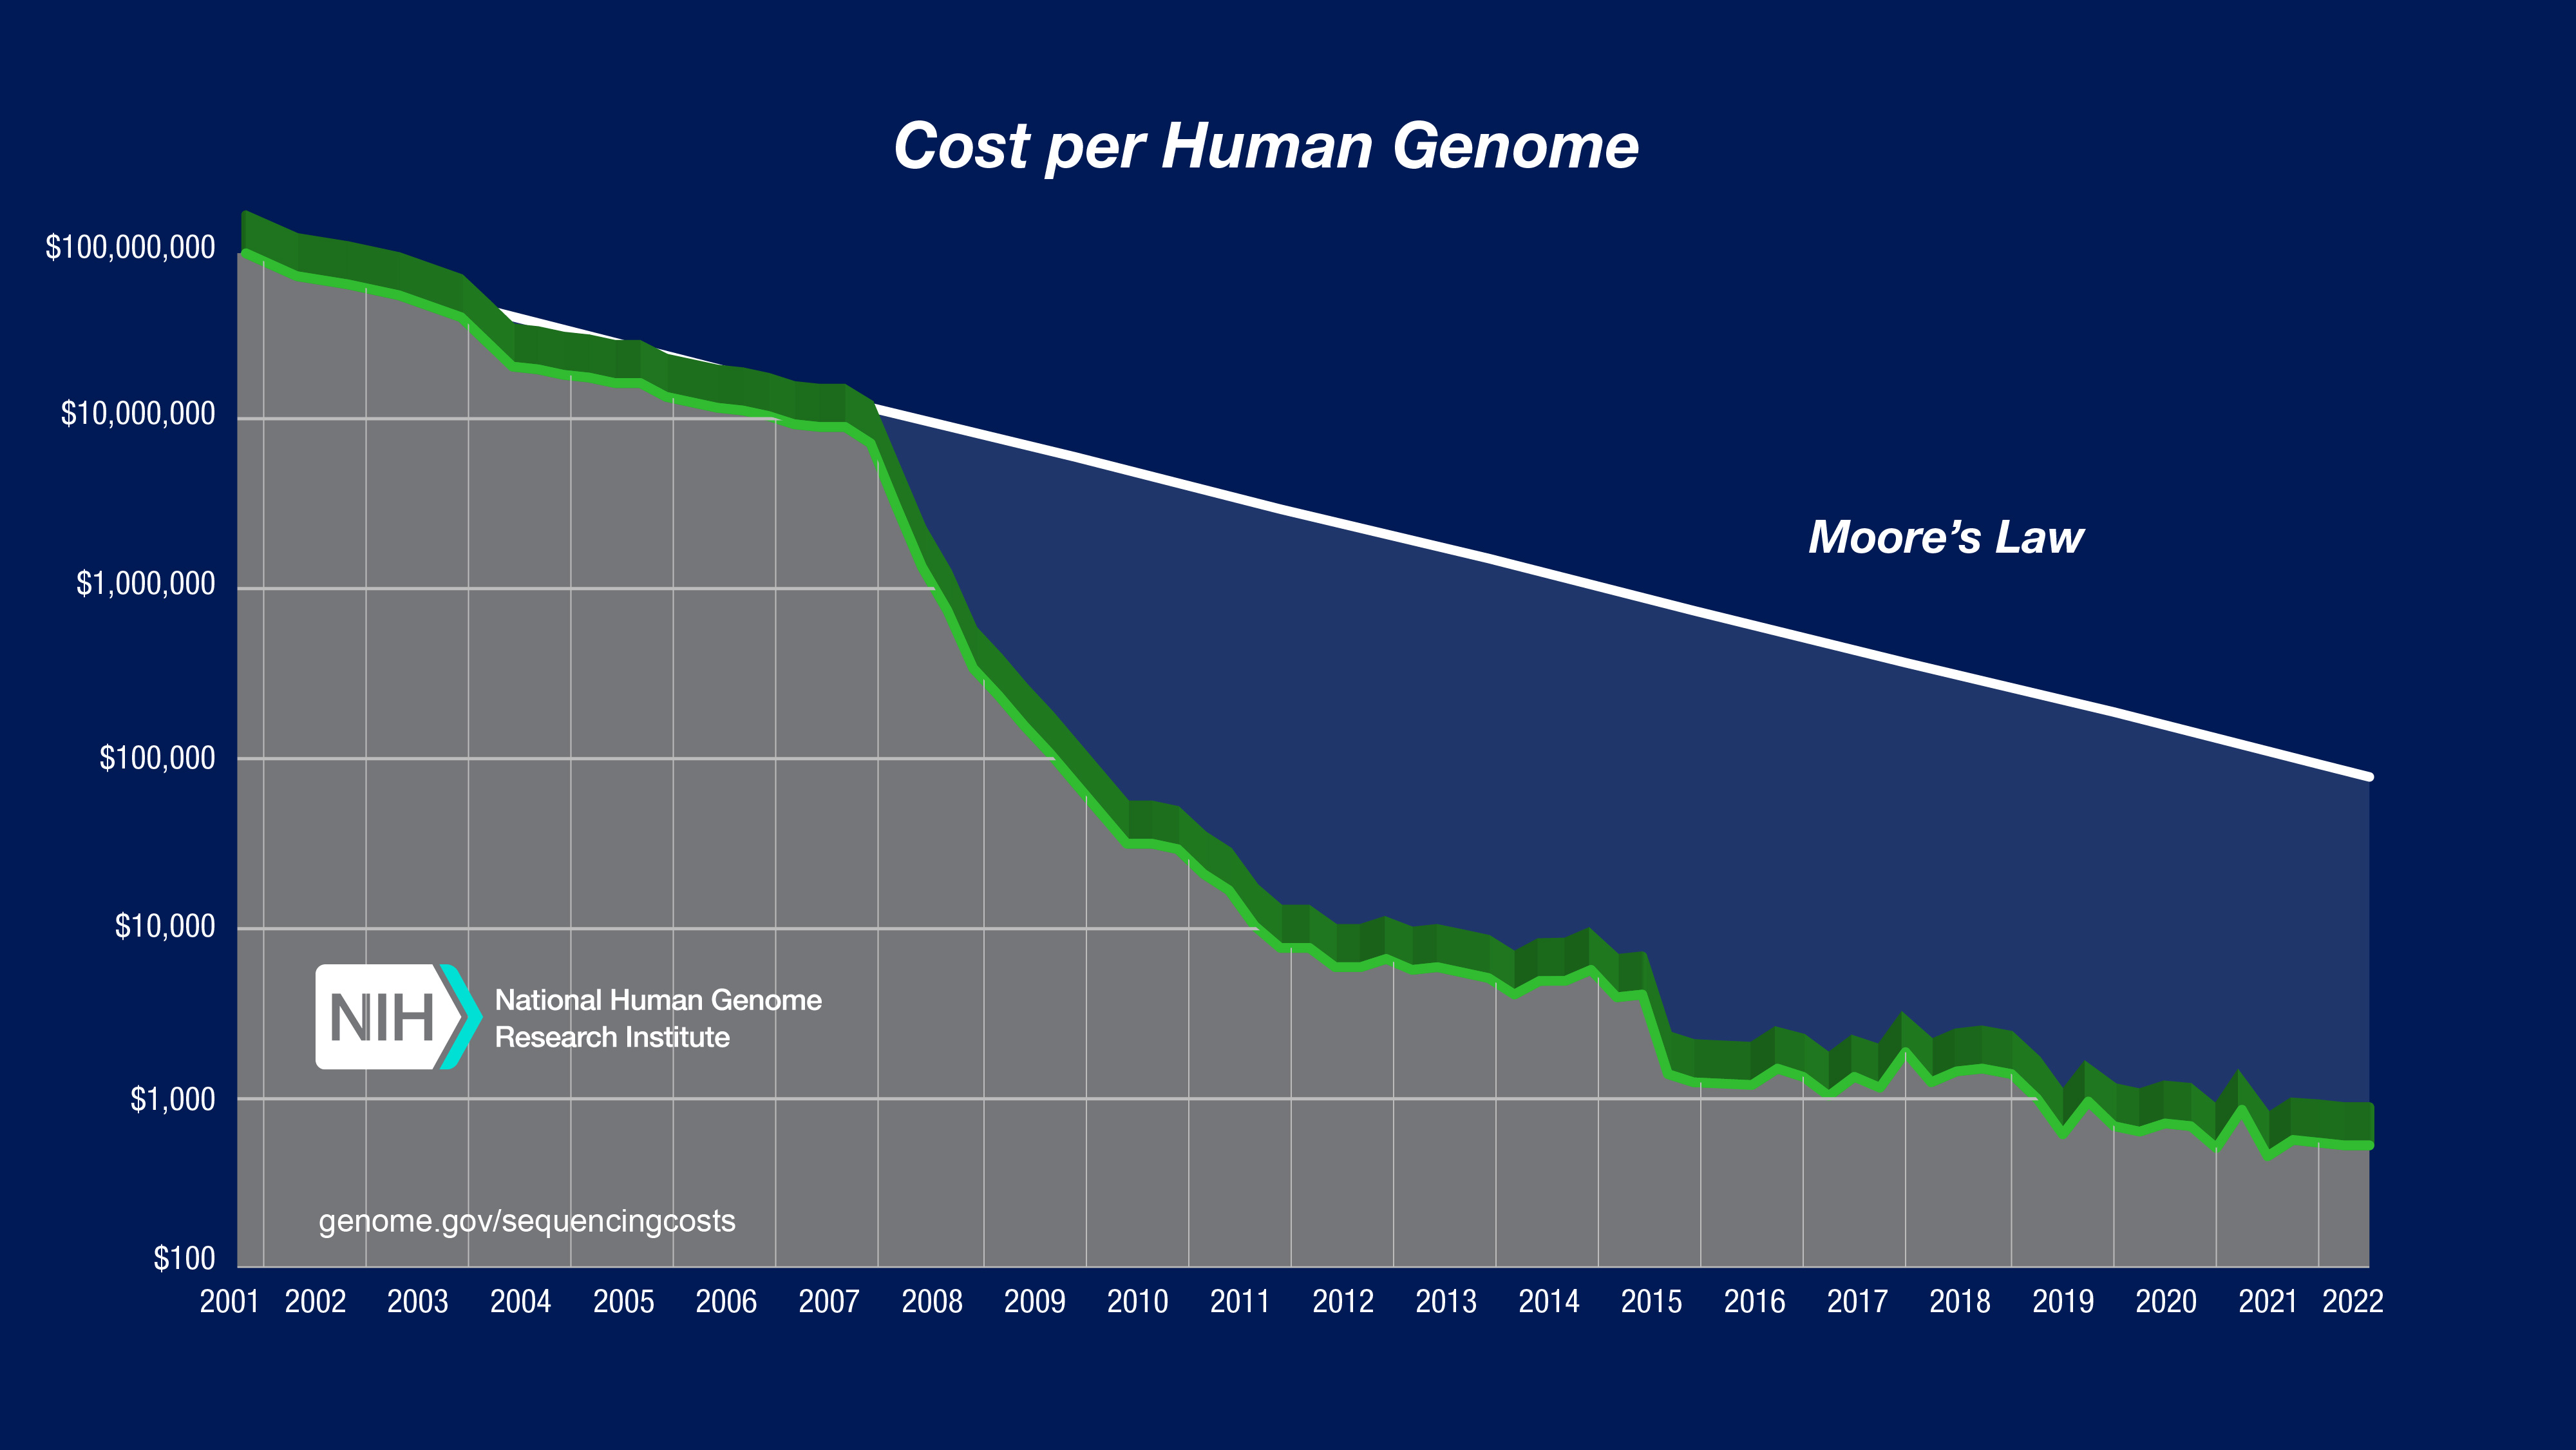
To illustrate the nature of the reductions in DNA sequencing costs, each graph also shows hypothetical data reflecting Moore's Law, which describes a long-term trend in the computer hardware industry that involves the doubling of 'compute power' every two years (See: Moore's Law [wikipedia.org]). Technology improvements that 'keep up' with Moore's Law are widely regarded to be doing exceedingly well, making it useful for comparison.

In both graphs, note: (1) the use a logarithmic scale on the Y axis; and (2) the sudden and profound out-pacing of Moore's Law beginning in January 2008. The latter represents the time when the sequencing centers transitioned from Sanger-based (dideoxy chain termination sequencing) to 'second generation' (or 'next-generation') DNA sequencing technologies. Additional details about these graphs are provided below.

These data, however, do not capture all of the costs associated with the NHGRI Large-Scale Genome Sequencing Program. The sequencing centers perform a number of additional activities whose costs are not appropriate to include when calculating costs for production-oriented DNA sequencing. In other words, NHGRI makes a distinction between 'production' activities and 'non-production' activities. Production activities are essential to the routine generation of large amounts of quality DNA sequence data that are made available in public databases; the costs associated with production DNA sequencing are summarized here and depicted on the two graphs. Additional information about the other activities performed by the sequencing centers is provided below.

Key Considerations

Cost Categories

The expenditures included in each category were established based on discussions between NHGRI staff and sequencing center personnel.

For the two graphs ("Cost per Megabase of DNA Sequence" and "Cost per Genome"), the following 'production' costs are accounted for:

  • Labor, administration, management, utilities, reagents, and consumables
  • Sequencing instruments and other large equipment (amortized over three years)
  • Informatics activities directly related to sequence production (e.g., laboratory information management systems and initial data processing)
  • Submission of data to a public database
  • Indirect Costs as they relate to the above items
     

In the case of costs covered by significant subsidies to a sequencing center (e.g., a grantee institution providing funds for purchasing large equipment), NHGRI has attempted to appropriately account for such costs in these analyses.

The costs associated with the following 'non-production' activities are not reflected in the two graphs:

  • Quality assessment/control for sequencing projects
  • Technology development to improve sequencing pipelines
  • Development of bioinformatics/computational tools to improve sequencing pipelines or to improve downstream sequence analysis
  • Management of individual sequencing projects
  • Informatics equipment
  • Data analysis downstream of initial data processing (e.g., sequence assembly, sequence alignments, identifying variants, and interpretation of results)
     

DNA Sequencing Technologies

In both graphs, the data from 2001 through October 2007 represent the costs of generating DNA sequence using Sanger-based chemistries and capillary-based instruments ('first generation' sequencing platforms). Beginning in January 2008, the data represent the costs of generating DNA sequence using 'second-generation' (or 'next-generation') sequencing platforms. The change in instruments represents the rapid evolution of DNA sequencing technologies that has occurred in recent years.

Quality

For the Sanger-based sequence data, the cost accounting reflects the generation of bases with a minimum quality score of Phred20(or Q20), which represents an error probability of 1 % and is an accepted community standard for a high-quality base. For sequence data generated with second-generation sequencing platforms, there is not yet a single accepted measure of accuracy; each manufacturer provides quality scores that are, at this time, accepted by the NHGRI sequencing centers as equivalent to or greater than Q20.

In the "Cost per Megabase of DNA Sequence" graph, the data reflect the cost of generating raw, unassembled sequence data; no adjustment was made for data generated using different instruments despite significant differences in the sequence read lengths. In contrast, the "Cost per Genome" graph does take these differences into account since sequence read length influences the ability to generate an assembled genome sequence.

Genome Coverage

The "Cost per Genome" graph was generated using the same underlying data as that used to generate the "Cost per Megabase of DNA Sequence" graph; the former thus reflects an estimate of the cost of sequencing a human-sized genome rather than the actual costs for specific genome-sequencing projects.

To calculate the cost for sequencing a genome, one needs to know the size of that genome and the required 'sequence coverage' (i.e., 'sequence redundancy') to generate a high-quality assembly of the genome given the specific sequencing platform being used. For generating the "Cost per Genome" graph, the assumed genome size was 3,000 Mb (i.e., the size of a human genome). The assumed sequence coverage needed differed among sequencing platforms, depending on the average sequence read length for that platform.

The following 'sequence coverage' values were used in calculating the cost per genome:
  • Sanger-based sequencing (average read length=500-600 bases): 6-fold coverage
  • 454 sequencing (average read length=300-400 bases): 10-fold coverage
  • Illumina and SOLiD sequencing (average read length=75-150 bases): 30-fold coverage
     

For data since January 2008 (representing data generated using 'second-generation' sequencing platforms), the "Cost per Genome" graph reflects projects involving the 're-sequencing' of the human genome, where an available reference human genome sequence is available to serve as a backbone for downstream data analyses. The required 'sequence coverage' would be greater for sequencing genomes for which no reference genome sequence is available.

  • Key Considerations

    Cost Categories

    The expenditures included in each category were established based on discussions between NHGRI staff and sequencing center personnel.

    For the two graphs ("Cost per Megabase of DNA Sequence" and "Cost per Genome"), the following 'production' costs are accounted for:

    • Labor, administration, management, utilities, reagents, and consumables
    • Sequencing instruments and other large equipment (amortized over three years)
    • Informatics activities directly related to sequence production (e.g., laboratory information management systems and initial data processing)
    • Submission of data to a public database
    • Indirect Costs as they relate to the above items
       

    In the case of costs covered by significant subsidies to a sequencing center (e.g., a grantee institution providing funds for purchasing large equipment), NHGRI has attempted to appropriately account for such costs in these analyses.

    The costs associated with the following 'non-production' activities are not reflected in the two graphs:

    • Quality assessment/control for sequencing projects
    • Technology development to improve sequencing pipelines
    • Development of bioinformatics/computational tools to improve sequencing pipelines or to improve downstream sequence analysis
    • Management of individual sequencing projects
    • Informatics equipment
    • Data analysis downstream of initial data processing (e.g., sequence assembly, sequence alignments, identifying variants, and interpretation of results)
       

    DNA Sequencing Technologies

    In both graphs, the data from 2001 through October 2007 represent the costs of generating DNA sequence using Sanger-based chemistries and capillary-based instruments ('first generation' sequencing platforms). Beginning in January 2008, the data represent the costs of generating DNA sequence using 'second-generation' (or 'next-generation') sequencing platforms. The change in instruments represents the rapid evolution of DNA sequencing technologies that has occurred in recent years.

    Quality

    For the Sanger-based sequence data, the cost accounting reflects the generation of bases with a minimum quality score of Phred20(or Q20), which represents an error probability of 1 % and is an accepted community standard for a high-quality base. For sequence data generated with second-generation sequencing platforms, there is not yet a single accepted measure of accuracy; each manufacturer provides quality scores that are, at this time, accepted by the NHGRI sequencing centers as equivalent to or greater than Q20.

    In the "Cost per Megabase of DNA Sequence" graph, the data reflect the cost of generating raw, unassembled sequence data; no adjustment was made for data generated using different instruments despite significant differences in the sequence read lengths. In contrast, the "Cost per Genome" graph does take these differences into account since sequence read length influences the ability to generate an assembled genome sequence.

    Genome Coverage

    The "Cost per Genome" graph was generated using the same underlying data as that used to generate the "Cost per Megabase of DNA Sequence" graph; the former thus reflects an estimate of the cost of sequencing a human-sized genome rather than the actual costs for specific genome-sequencing projects.

    To calculate the cost for sequencing a genome, one needs to know the size of that genome and the required 'sequence coverage' (i.e., 'sequence redundancy') to generate a high-quality assembly of the genome given the specific sequencing platform being used. For generating the "Cost per Genome" graph, the assumed genome size was 3,000 Mb (i.e., the size of a human genome). The assumed sequence coverage needed differed among sequencing platforms, depending on the average sequence read length for that platform.

    The following 'sequence coverage' values were used in calculating the cost per genome:
    • Sanger-based sequencing (average read length=500-600 bases): 6-fold coverage
    • 454 sequencing (average read length=300-400 bases): 10-fold coverage
    • Illumina and SOLiD sequencing (average read length=75-150 bases): 30-fold coverage
       

    For data since January 2008 (representing data generated using 'second-generation' sequencing platforms), the "Cost per Genome" graph reflects projects involving the 're-sequencing' of the human genome, where an available reference human genome sequence is available to serve as a backbone for downstream data analyses. The required 'sequence coverage' would be greater for sequencing genomes for which no reference genome sequence is available.

References

Mardis E. A decade's perspective on DNA sequencing technology. Nature, 470: 198-203. 2011. [PubMed]
Metzker M. Sequencing technologies - the next generation. Nature Genetics, 11: 31-46. 2010. [PubMed]
Stein L. The case for cloud computing in genome informatics. Genome Biology, 11: 207-213. 2010. [PubMed]

Human genome at ten: the sequence explosion. Nature, 464: 670-671. 2010. [PubMed]
NHGRI Genome Sequencing Program

How to Cite this Web Page:
Wetterstrand KA. DNA Sequencing Costs: Data from the NHGRI Genome Sequencing Program (GSP) Available at: www.genome.gov/sequencingcostsdata. Accessed [date of access].

Contact

Kris Wetterstrand, M.S.
Kris A. Wetterstrand, M.S.
  • Scientific Liaison to the Director for Extramural Activities
  • Office of the Director

Last updated: May 16, 2023